Introduction
- U-Net
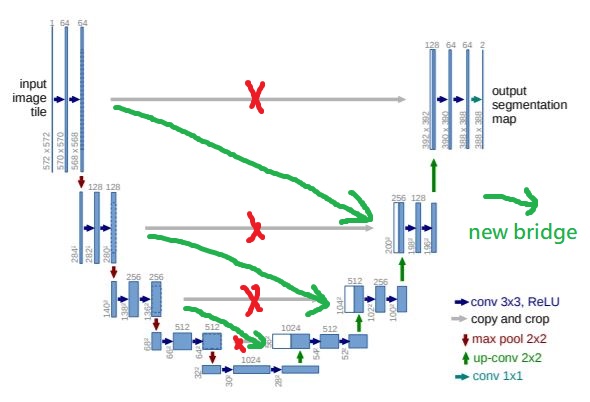
- The U net is the deep learning model to label images. The network model is illustrated as follows. It consists of a contracting path (left side) and an expansive path (right side).
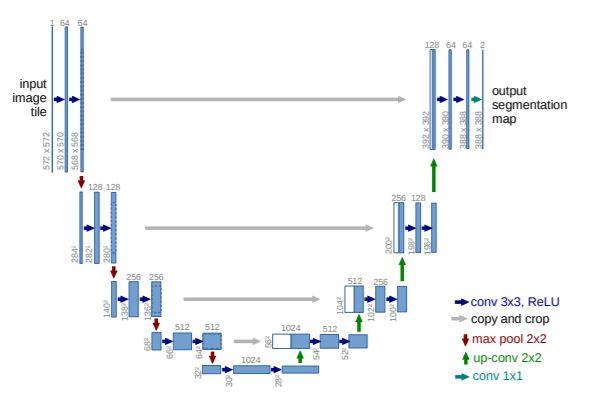
Figure: Network architecture of U-net. This figure is taken from Ronneberger [1]. - Lung Data
- A pair of data which consist of a 3D lung image and a 3D label of nodule. There are 47 patients. We divide the Lung 3D image into many tiles, whose size is 124x140x140. And Output is 3D label, whose size is 36x52x52. There are 23844 tiles. Each tile have a region which overlapping with neighboring tiles. However, we use these 3D tile as input data. Output is 3D tiles of label which are non-overlapping.
Goals
The aim work is to build a model to detect lung nodule regions. However, we face a problem is ``over-fitting”. Since there are only 609 tiles of label have nodules, i.e. it’s about 2.5%, output label usually overfits to no nodule or input data. Hence, we use the following method to solve above problem.
-
Minimize the Model: Although there are many tiles, there are only 2.5% tiles containing nodule. Hence, if there are lots of parameter, then this model cannot learn something.
-
Modify Bridge: Change the destination of bridge for lower level, as showed in following figure.
- Repeat the Non-trivial Tiles: I try to repeat the non-trivial data 9 times. I choose 9, because make sure non-trivial data accounts for 25% of overall data. Then, there are about 1 non-trivial data in every mini-batch (4 data in 1 mini-batch).
Results
I use the method introduced in above section. The training result is presented in following table. It seems that it’s still a little over-fitting. On the other hands, the test loss is 0.0007 and test dice coefficient is 0.8810. (The number of test tiles is 3577.)
| num of epoch | train loss | train dice coeff | val loss | val dice coeff | time |
|---|---|---|---|---|---|
| 1 | 0.0345 | 0.2226 | 0.0677 | 0.2158 | 7hrs 29mins |
| 2 | 0.0053 | 0.5316 | 0.0005 | 0.8991 | 7hrs 29mins |
| 3 | 0.0038 | 0.6074 | 0.0005 | 0.8830 | 7hrs 45mins |
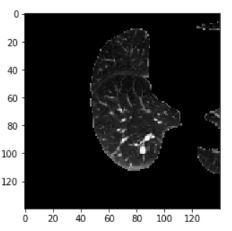
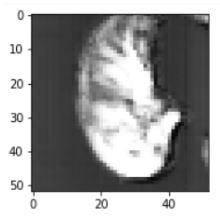
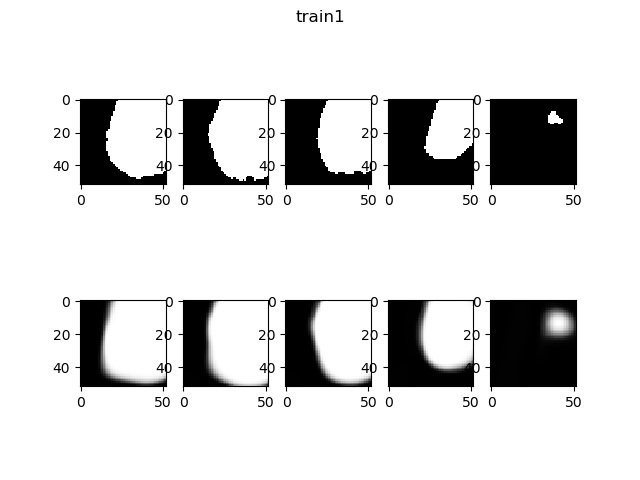
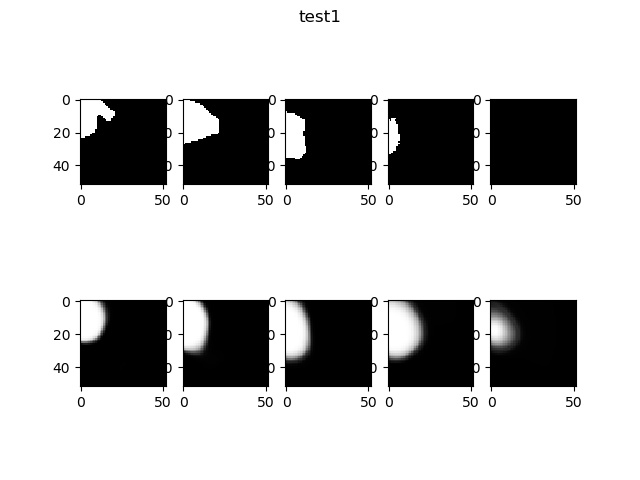
Now, display some result of this model. Compare the origin label (up figure) and the output label of the training or test data (down figure).
References
- O. Ronneberger, P. Fischer and T. Brox, U-Net: Convolutional Networks for Biomedical Image Segmentation, (2015).
Acknowledgements
Thanks my classmates Yuehchou Lee and Chiatse Wang. I would like to thank Dr. Wang for the guidance and encouragement.