
Introduction
Persistent homology is a powerful tool in computational topology for studying the evolution of topological features in data sets across different scales. It provides a way to analyze the lifespan or persistence of features such as connected components, voids, and holes.
The key idea is to examine the changes in homological features as a parameter (often related to scale) varies. Persistent homology is particularly useful for capturing topological information that persists through multiple scales, offering a robust representation of the underlying structures in the data.
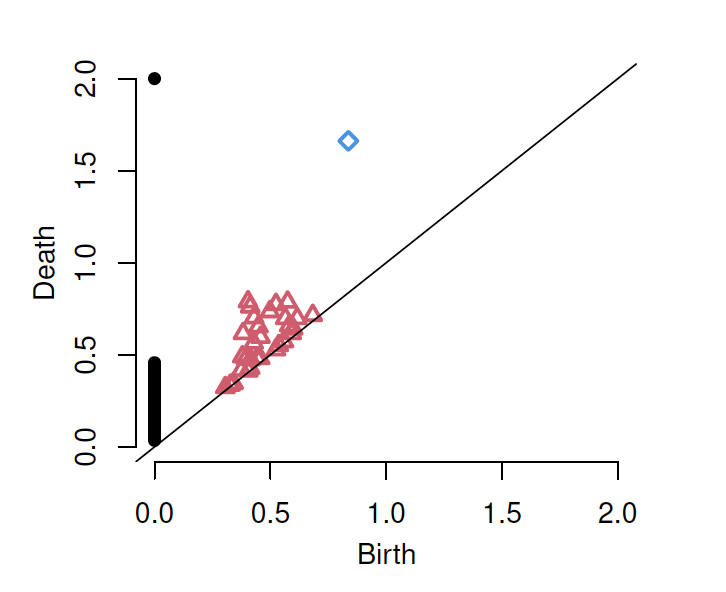
The persistent diagram is a visual representation of the persistent homology results. It consists of points in the plane, where each point corresponds to a homological feature. The x-coordinate represents the scale at which the feature is born, and the y-coordinate represents the scale at which it dies.
For instance, the following figure shows the persistence diagram of the point cloud drawn from a 2-dim sphere; the black filled circles correspond to \(k = 0\), the red triangles correspond to \(k = 1\), and the blue squares correpond to \(k = 2\).
References
- F. Chazal & B. Michel, An introduction to Topological Data Analysis: fundamental and practical aspects for data scientists, (2021).
- L. Wasserman, Topological Data Analysis, (2018).